Financial

Review

The financial results of the Company for the financial year 2019-20 compared with the previous year are summarised hereunder:

(₹ in Million)
Description FY-20 FY-19 Change %
Revenue from
operations (gross)
8,099.0 8287.9 (2.3)
Other Income 218.4 161.8 35.0
EBITDA 1,655.9 1569.2 5.5
EBITDA Margin 20.4% 18.9%
Depreciation &
Amortisation
200.8 201.0 (0.1)
PBIT 1,455.1 1368.2 6.4
PBIT Margin 18.0% 16.5%
Finance Cost 33.3 11.2 197.3
PBT 1,421.7 1357.0 4.8
PBT Margin 17.6% 16.4%
PAT 1,100.6 875.4 25.7
PAT Margin 13.6% 10.6%
Other Comprehensive
Income (net of Tax)
(81.4) 44.0 (285.0)
Total Comprehensive
Income
1,019.2 919.4 10.9

The aforesaid summarised financial results are based on the standalone financial statements which have been prepared in accordance with Indian Accounting Standards (Ind AS) notified under the Companies Act, 2013 ("the Act") and other relevant provisions of the Act.

During the year, the Company adopted Ind AS 116 "Leases" using modified retrospective method. The adoption of this standard did not have any material impact on the profit of year ended March 31, 2020.

Financial Performance

Revenue from Operations is marginally lower than previous year by 2.3%. The financial performance of the Company started impacting from the 4th quarter of the year. Covid -19 pandemic has severely impacted the world economy, particularly from the beginning of the year 2020, including India. The operations of the Company are also impacted, particularly during the lockdown period as both the factories and all sales and service offices were closed. Due to logistics bottlenecks, closure of customers' site and suspension of travel, there was an impact on sales and profits. Further, slowdown in domestic economy, particularly in later part of the year, has also impacted domestic sales. In terms of profitability, the performance is better than previous year due to on-going value engineering and various supply chain initiatives taken during the year. The Company is focussed to develop upgraded efficient models with cost optimisation and launched some for these models in current year which improved the margins. Efficiency in conversion cost is also achieved during the year.

The working capital of the Company improved compared to previous year as a result of which liquidity was comfortable. The Company continues to remain debt free, barring loans for vehicles.

Revenue from Operations

Revenue from both Product and Aftermarket sales has come down by 0.4% and 8.3% respectively for the reasons as stated above. The revenue in Product as well as in Aftermarket Sales segment is shown below:

(₹ in Million)
Description FY-20 FY-19 Change %
Product Sales 6,283.8 6,307.7 (0.4)
% to Total Sales 77.6% 76.1%
Aftermarket Sales 1,815.2 1,980.2 (8.3)
% to Total Sales 22.4% 23.9%
Total Sales 8,099.0 8,287.9 (2.3)

Certain export consignments were struck up in the port towards end of the year due to lockdown and non-availability of vessels. Even, after market revenues were impacted as several customers could not arrange payments before the year end, mainly due to covid 19 pandemic. Due to these reasons, the Company has lost revenues of at least ₹ 500 million during the year for which goods were ready.

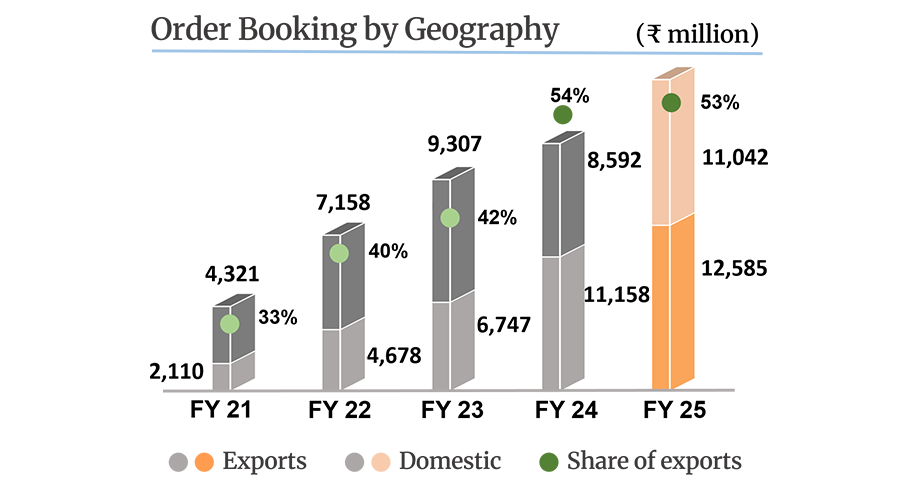
During the year, the exports were almost flat, but there was a dip in domestic market, mainly due to slow down in Indian economy. The percentage change in sales mix of Domestic and Exports is shown in table below:

(₹ in Million)
Description FY-20 FY-19 Change %
Export 3,841.5 3,827.9 0.4
% to Total Sales 47.4% 46.2%
Domestic 4,257.5 4,460.0 (4.5)
% to Total Sales 52.6% 53.8%
Total Sales 8,099.0 8,287.9 (2.3)

Other Income

Other Income has increased by 35.0% over previous year. The increase is mainly due to dividend income received from the Company's wholly owned foreign subsidiary, Triveni Turbines Europe Pvt Ltd., UK, amounting to ₹ 65 Million. Further, the Company has earned higher income from investment from various mutual fund schemes and bank fixed deposits over previous year, as surplus fund from operation increased.

Expenses

Raw Material consumption

(₹ in Million)
Description FY-20 FY-19 Change %
Raw material
consumption and
change in inventories
4,401.8 4,656.6 -5.5
Percentage of sales 54.3% 56.2%

Decrease in Raw Material cost by 5.5% over previous year is a combined effect of lower sales by 2.3% and reduction in material costs arising from various value engineering and supply chain initiates taken by the Company. The Company has long term relationship with major and minor vendors and have well established pricing policy. This helps for consistent quality, on time deliveries and price. The Company is constantly focussing to deliver turbines at competitive price with improved efficiency.


Personnel cost, Other Expenses and Depreciation

(₹ in Million)
Description FY-20 FY-19 Change %
Employee cost 943.9 911.7 3.5%
% to Total Sales 11.7% 11.0%
Other Expenses 1,271.1 1,307.8 (2.8%)
% to Total Sales 15.7% 15.8%
Depreciation &
Amortisation
200.8 201.0 (0.1%)
% to Total Sales 2.5% 2.4%

Employee Cost

The increase in employee cost is due to annual increment as per Company's policy. However, there is reduction in number of employees during the year, which partially offset effect of annual increment. The industrial relations were cordial.

Other Expenses

Other expenses include manufacturing expenses, administrative expenses and selling expenses. Manufacturing expenses such as Store, Spares and Tools consumed and Power & fuel etc. are semi-variable in nature. Due to improvement in manufacturing process, the manufacturing cost was significantly lower in the current year over previous year. There is no significant variation over previous year in other administrative expenses except that certain provisions were made for expected future cost of warranty and receivables as per Company's accounting policy. Selling expenses are also lower than last year in view of logistic and other cost savings. Over all, there was 2.8% savings in Other Expenses over previous year.

Depreciation and Amortisation

There are no material changes in depreciation and Amortisation expenses as compared to previous year.

Balance Sheet

Major items, including where significant changes have taken place during the year are being explained hereunder:

Non-Current Assets

Property, Plant and Equipment (PPE), Capital work in progress & Intangible assets

There is no major investment in Plant and Machinery or civil work made during the year. However, due to adoption of Ind AS 116 "Leases" the Company has created Right of Use assets of ₹ 34.0 Million under PPE.

Capital work in progress mainly includes extension of a civil structure work in Somapura plant to provide enhanced facility of testing of turbines. This will be completed by the second quarter of next year.

Non-current investment

This represents investment in wholly owned foreign subsidiary and joint venture in India. There is no further investment during the year. The accumulated profits of joint venture, under equity method of accounting, are included under this head.

Current Assets

Inventories

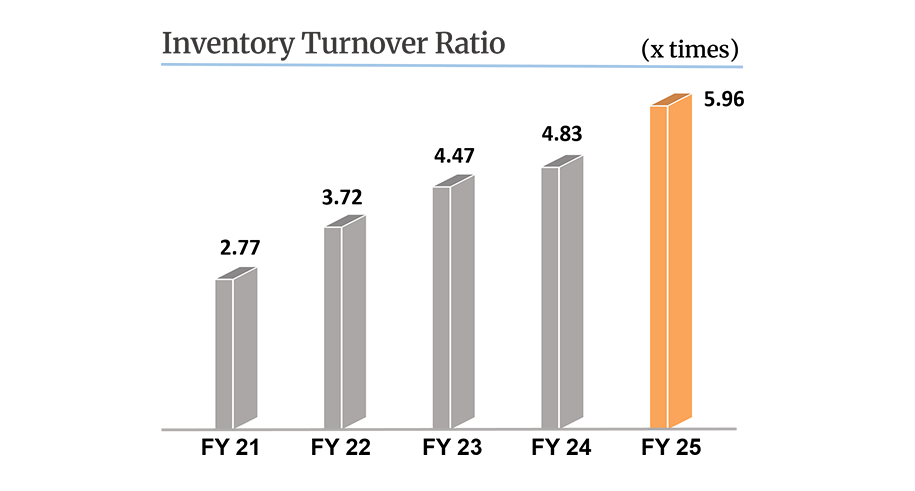
Inventory has significantly decreased by ₹ 442.7 million over previous year. The decrease is mainly in raw material and component by ₹ 254.8 million as a result of planned efforts to optimise working capital structure. Similarly, Work-in- Progress was also decreased by ₹143.1 million due to improvement in production planning. This has resulted in improvement of inventory turnover ratio and cash inflows. The Company improved its strategy of Procedure to Pay inventory management system and are being monitored on regular basis for ensuring its effectiveness and minimum lead time.

Trade Receivables (Current)

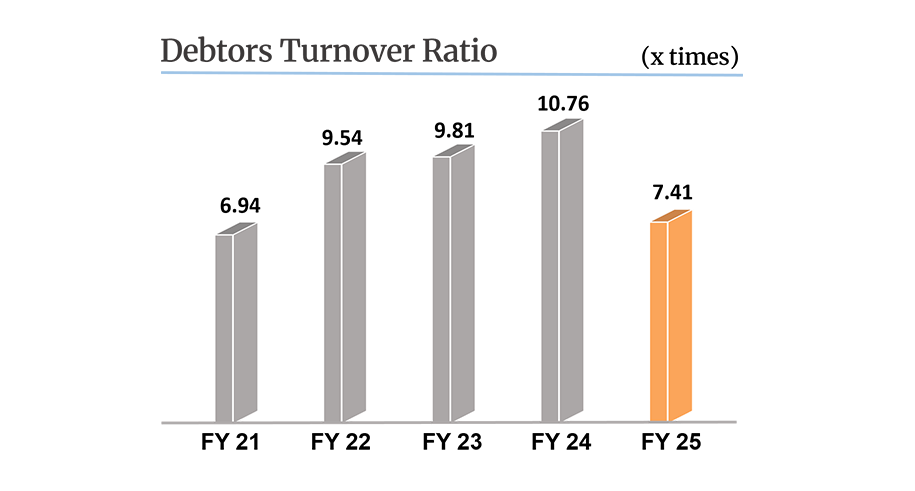
Trade Receivables have decreased by ₹ 517.5 million over previous year due to improved realisation of dues. About 26% of Trade receivables is secured against Letter of Credit and about 30% is contractually not due. There remaining receivables are considered to be good and appropriate provisions are made, whenever considered doubtful.

Other financial assets

Other financials assets have decreased by ₹ 103.6 million over previous year. This is due to adjustment of MTM gain on derivatives financial instruments i.e. forward contract of ₹100.9 million against the sales in current year in compliance with hedge accounting policy of the Company. As on March 31, 2020, MTML loss on forward contract of ₹ 60.4 million has been shown under other financial liability.

Other current assets

Other current assets have increased by ₹ 144.4 million over previous year. Increase in other current assets is mainly due to higher GST input tax credit of ₹ 132.21 million receivable from GST authorities as compared to previous year. There are certain delays in obtaining GST refunds on exports from Customs Department, which the Company has taken up with the authorities for fast resolution. All other items under this head, including Export Incentive receivables from DGFT and advance paid to vendors etc. are normal in nature and fully recoverable.

Non-Current Liabilities

These mainly comprise deferred tax liabilities (net) and certain long term provisions towards employee benefits as mandated by relevant provisions of Ind AS, warranty etc. which are made in normal course of business.

Current Liabilities

Current liabilities mainly consist of Trade Payable for purchase of goods and services and Advances from Customers. Trade Payable has decreased to ₹ 637.3 million from ₹ 1,188.1 million in view of reduction of purchases in a planned manner to bring down inventory and increase in cash flows. The other major components of Current Liabilities are Advances from Customers which increased by ₹ 289.5 million over previous year.

Consolidated Financial Statements

Consolidated financial statements have been prepared consolidating the results of a wholly owned foreign subsidiary, Triveni Turbines Europe Pvt. Ltd. (TTEPL), UK, its step down subsidiary, Triveni Turbines DMCC (TTDMCC), Dubai and Triveni Turbines Africa (Pty) Ltd (TTAPL). The Consolidation is made by adding line by line items complying relevant provisions of Ind AS. In addition, the Company has a domestic subsidiary company namely GE Triveni Ltd. (GETL) which, in accordance with Ind AS, been considered as a Joint Venture and accordingly accounted by using equity method for preparation of consolidated financial statements.

Headline figures for consolidated financial statements duly compared with standalone are provided here under:

(₹ in Million)
Financial Statements
Consolidated Standalone
1. Revenue from operations (gross) 8,178.7 8,099.0
2. Profit before tax 1,468.5 1,421.7
3. Share of income of
joint venture
90.9 -
4. Profit after tax 1,217.8 1100.6