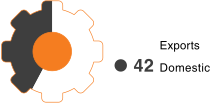
Share of Domestic and Export Sales (%)

Our ability to see opportunity in challenges helped us maintain a strong financial foundation, supported by adequate liquidity and a healthy balance sheet position in FY 26. We also continued to deliver operational excellence at the back of our robust infrastructural and asset base.
Revenue from Operations
Closing Order Book
(as on March 31, 2026)
EBITDA
Closing Aftermarket Orders
(as on March 31, 2026)
EBITDA Margin
PAT
Domestic Order Book
(as on March 31, 2026)
Export Order Book
(as on March 31, 2026)
Order Booking
Manufacturing facilities
Industries Served
Countries of Presence
R&D centres
Employees
Improvement in assembly throughput time