Corporate Overview
Management Discussion & Analysis
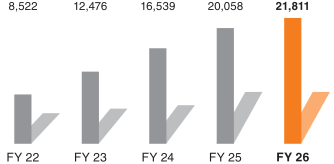
EBITDA & EBITDA Margin
(₹ million)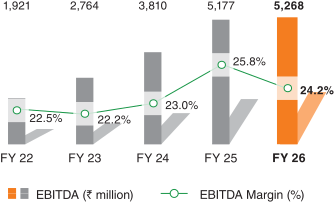
PAT & PAT Margin
(₹ million)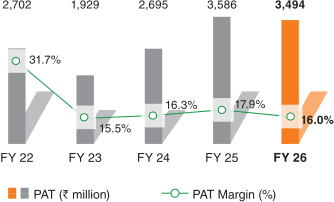
Order Booking
(₹ million)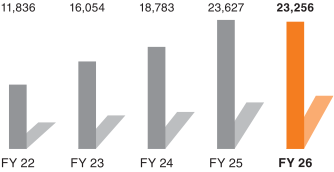
Working Capital#
(₹ million)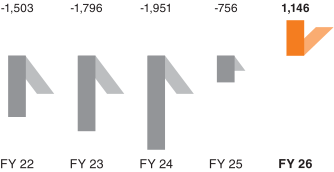
Inventory Turnover Ratio
(x times)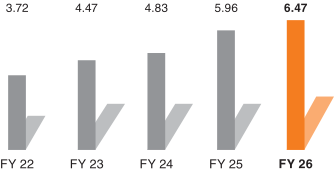
Note: PAT and PAT margins for FY 26 & FY 22 include the impact of one-time exceptional item of ₹ 157 million (expense) & ₹ 1,982 million (Income) respectively
# Without Cash & Investment
Revenue (₹ million unless specified)
By Geography
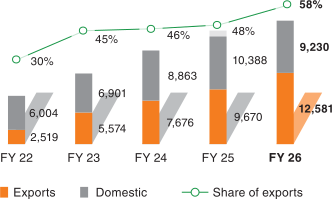
By Segments
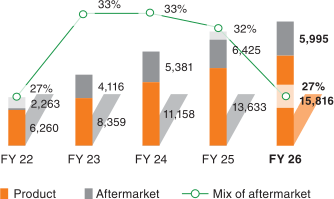
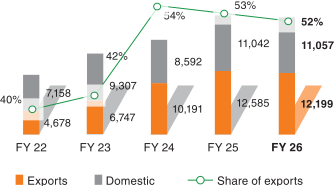
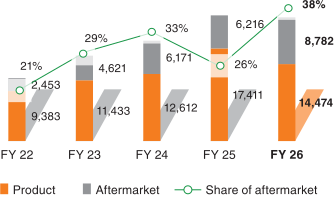
Order Booking (₹ million unless specified)
By Geography
By Business Segments
Assets Turnover Ratio
(x times)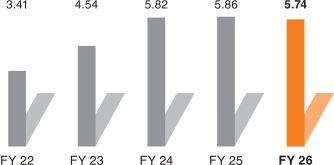
Debtors Turnover Ratio
(x times)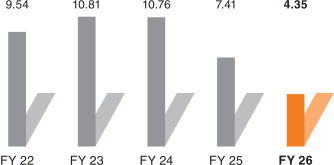
Free Cash Flows
(₹ million)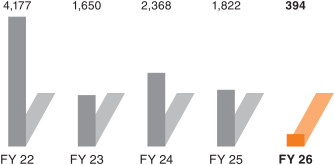
Investment Including Cash
(₹ million)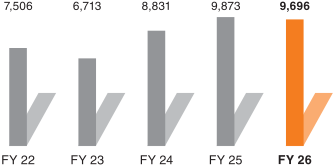
Employee Expenses
(₹ million)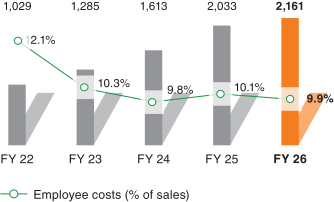
Cost of Goods Sold
(₹ million)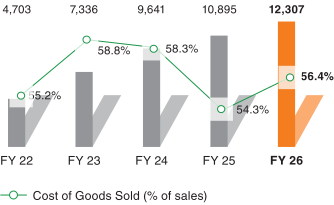
FY 26 : Value Created for Stakeholders
Suppliers
54.8%Input materials directly sourced from micro, small & medium enterprises (MSMEs)/small producers
Community
₹ 63.7 millionTotal CSR outlay
Customers
₹ 23,256 millionOrder booking
Employees
₹ 2,161 millionEmployee benefits