| Revenue and profit |
|
|
|
|
|
|
| 1.Income from operations |
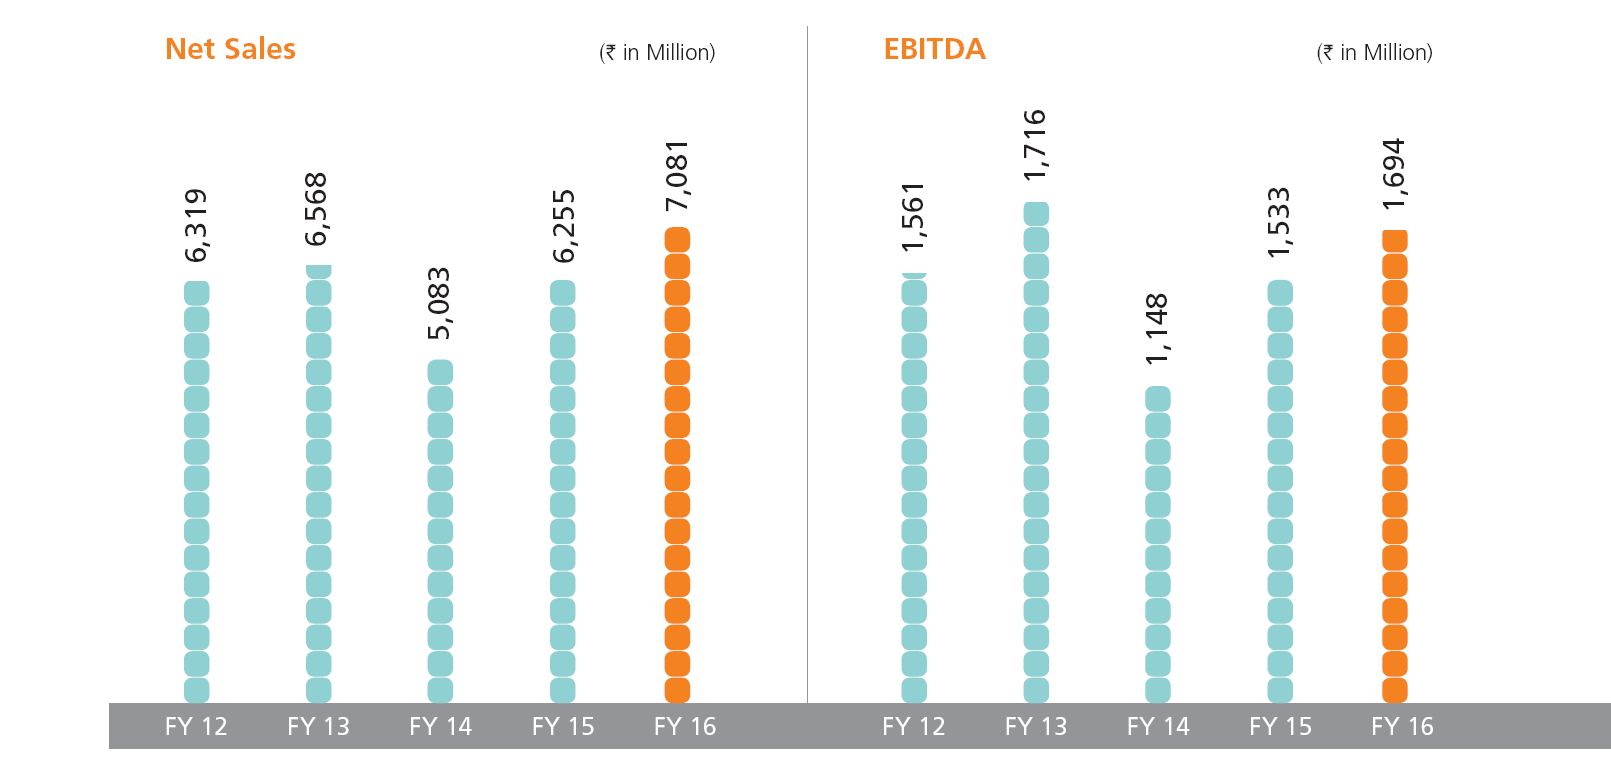
Million |
7081.35 |
6255.22 |
5082.66 |
6568.47 |
6318.82 |
| 2.Other Income |
Million |
138.68 |
276.55 |
83.72 |
81.06 |
46.86 |
| 3.Total expenses |
Million |
5526.15 |
4998.56 |
4018.18 |
4933.08 |
4804.70 |
| 4.EBITDA |
Million |
1693.87 |
1533.21 |
1148.20 |
1716.45 |
1560.98 |
| 5.PBT |
Million |
1550.56 |
1355.67 |
1013.61 |
1566.58 |
1349.12 |
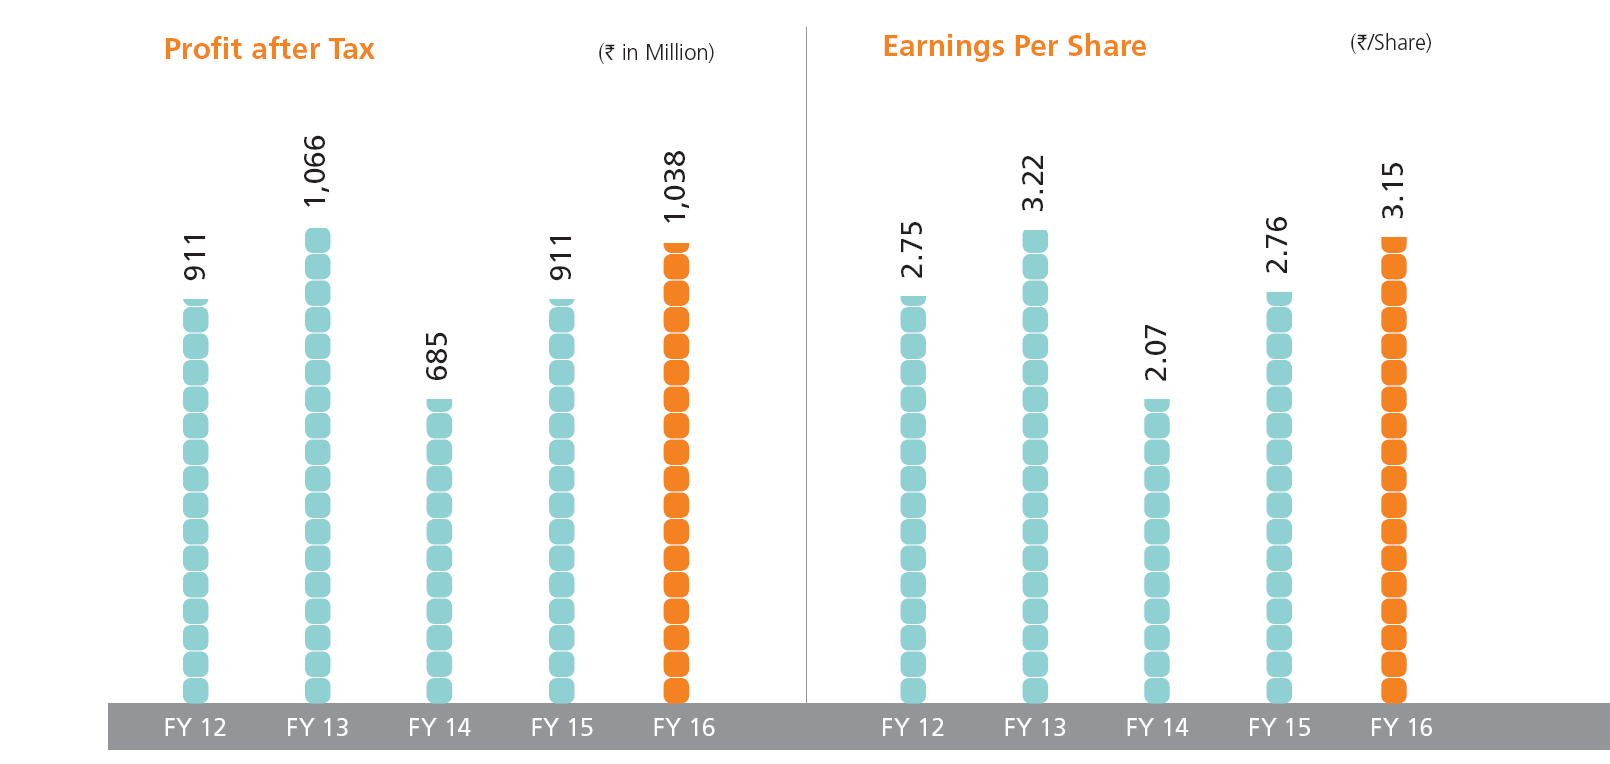
| 6. PAT |
Million |
1038.15 |
910.84 |
684.52 |
1066.25 |
910.81 |
| Balance Sheet |
|
|
|
|
|
|
| Liabilities and equity |
|
|
|
|
|
|
| 1. Shareholder's Funds |
Million |
2957.33 |
2356.04 |
1811.77 |
1441.85 |
686.34 |
| 2. Non-current Liabilities |
Million |
129.05 |
140.72 |
143.37 |
136.63 |
317.79 |
| 3. Current Liabilities |
Million |
2622.27 |
2603.92 |
2672.35 |
2384.77 |
2179.72 |
| Total liabilities |
Million |
5708.65 |
5100.68 |
4627.49 |
3963.25 |
3183.85 |
| Assets |
|
|
|
|
|
|
| 1.Non-current Assets |
Million |
2091.01 |
1758.26 |
1785.30 |
1392.46 |
1378.35 |
| 2.Current Assets |
Million |
3617.64 |
3342.42 |
2842.19 |
2570.79 |
1805.50 |
| Total assets |
Million |
5708.65 |
5100.68 |
4627.49 |
3963.25 |
3183.85 |
| Cash flows |
|
|
|
|
|
|
| Net Cash flow from Operating Activities |
Million |
1391.33 |
576.87 |
290.67 |
726.59 |
1235.92 |
| Net Cash flow from Investing Activities |
Million |
-466.68 |
-166.94 |
-309.69 |
-9.01 |
-333.68 |
| Net Cash flow from Financing Activities |
Million |
-696.05 |
-376.34 |
-253.25 |
-557.29 |
-789.17 |
| Net increase/(decrease) in cash and cash equivalent |
Million |
228.60 |
33.59 |
-272.27 |
160.29 |
113.07 |
| Cash and cash equivalent at the beginning of the year |
Million |
39.50 |
5.91 |
278.18 |
117.89 |
4.82 |
| Cash and cash equivalent at the end of the year |
Million |
268.10 |
39.50 |
5.91 |
278.18 |
117.89 |
| Stock market information |
|
|
|
|
|
|
| Earnings Per Share (EPS) |
/share |
3.15 |
2.76 |
2.07 |
3.22 |
2.75 |
| Dividend per share (DPS) |
/share |
1.10 |
0.85 |
0.75 |
0.80 |
0.65 |
| Triveni stock price (BSE closing price) |
/share |
95.70 |
128.85 |
72.55 |
52.45 |
47.75 |
| High |
/share |
138.80 |
137.90 |
72.70 |
63.50 |
52.50 |
| Low |
/share |
87.50 |
67.30 |
45.00 |
40.35 |
30.00 |
|
|
|
|
|
|
|
| Market capitalization |
Million |
31,578 |
42,517 |
23,937 |
17,302 |
15,752 |
| Year on year growth |
% |
-26% |
78% |
38% |
10% |
|
| Credit rating of long-term debt (ICRA) |
|
AA- |
AA- |
A+ |
A+ |
A+ |